Understanding Instagram Profile Interaction Insights. In the highly competitive landscape of digital marketing, understanding how your audience engages with your brand is the bedrock of sustained success. Instagram profile interaction insights provide a clear window into the behaviors, desires, and pain points of your followers. By translating raw platform data into actionable strategies, you can transform your Instagram marketing from a guessing game into a model of precision. By leveraging a deep understanding of these metrics, you can refine your content, boost conversions, and build an authoritative presence. For those looking to gain deeper visibility into content performance or monitor trends across the platform, utilizing specialized tools like InstaSPY can enhance your strategy by offering broader context beyond standard native analytics.
What Are Instagram Profile Interaction Insights? Instagram profile interaction insights are specific performance metrics provided by the platform that measure the effectiveness of your profile, your content strategy, and your brand identity. These metrics move far beyond the surface-level utility of likes and comments to demonstrate how users physically navigate your profile. The primary indicators include profile visits, which quantify how many unique accounts viewed your page after engaging with a post; website clicks, which act as the ultimate conversion point for your call-to-action (CTA); and direct contact actions, such as email taps or 'Get Directions' clicks. These signals identify high-intent users who have moved from passive scrolling to active investigation of your brand. Understanding these interactions is essential to determining whether your presence serves as a passive portfolio or a high-converting business engine.
The Mechanism Behind the Data. When a user interacts with your profile, Instagram records these events as specific nodes of intent. Profile visits are triggered when a user taps your handle, usually signaling curiosity or a desire for validation. Website clicks are the most critical conversion point within the in-app ecosystem. Instagram’s algorithm is fundamentally designed to maximize 'Time Spent' on the platform. When your content successfully pulls a user away from their feed to visit your profile, you signal to the algorithm that your account is an authority figure, which can boost your reach in the long term. Monitoring these movements via native tools—or supplementing your research with external analytical platforms—allows you to reverse-engineer which specific posts act as the catalyst for traffic. You must view your profile as a secondary destination where every pixel is designed to convert a visitor into a lead or customer.
The Strategic Value of Interaction Data. Interaction data acts as a vital feedback loop. When you understand the correlation between a specific content format—such as a carousel versus a reel—and a subsequent increase in profile visits, you can replicate that success with precision. These insights allow you to categorize your audience into three tiers: those who appreciate your aesthetic, those who engage with your educational content, and those ready to take action by visiting your linked resources. By identifying these patterns, you minimize wasted effort and focus on high-impact production. This data also allows you to calculate the 'conversion intent' of your demographic. If your engagement is high but profile visits remain low, your content is failing to provide a 'curiosity gap' that compels the user to learn more about the account behind the post.
Measuring Intent vs. Vanity Metrics. Vanity metrics, such as follower count or simple like totals, are often misleading. They measure popularity but rarely represent profitability. Interaction data, specifically profile visits and link taps, provides a granular look at the 'warmth' of your audience. If your profile visits are high but conversions are low, your landing page or bio structure is the primary bottleneck. If profile visits are low, your content is not intriguing enough to drive curiosity. This diagnostic approach turns your analytics into a surgical tool for business growth, helping you decide whether to pivot your creative direction or optimize your sales funnel.
Practical Steps to Master Your Analytics. Mastering these metrics requires a structured, scientific approach to your daily operations.
- Establish a Consistent Monitoring Routine. Consistency is the foundation of data-driven decision-making. Instead of checking your dashboard sporadically, set a weekly cadence to review your profile interaction insights. Document the trends you see over a month. Did a strategic shift toward short-form video content lead to a measurable spike in profile visits? If so, prioritize that format. For those who need to evaluate broader market activity patterns, using external analytical resources can provide the necessary context to streamline your workflow and identify outliers in your growth trajectory that might not be visible in the native interface.
- Optimize Your Call-to-Action (CTA). If your interaction insights show high profile visits but low website clicks, your CTA is likely the culprit. Experiment with your bio text by using clear, benefit-driven language rather than passive instructions. Track these changes week-over-week to see if specific phrases or emojis trigger higher click-through rates. The user journey from viewing a post to clicking a link is incredibly fragile; keep it frictionless by using a dedicated landing page that matches the tone, visual style, and message of your Instagram content.
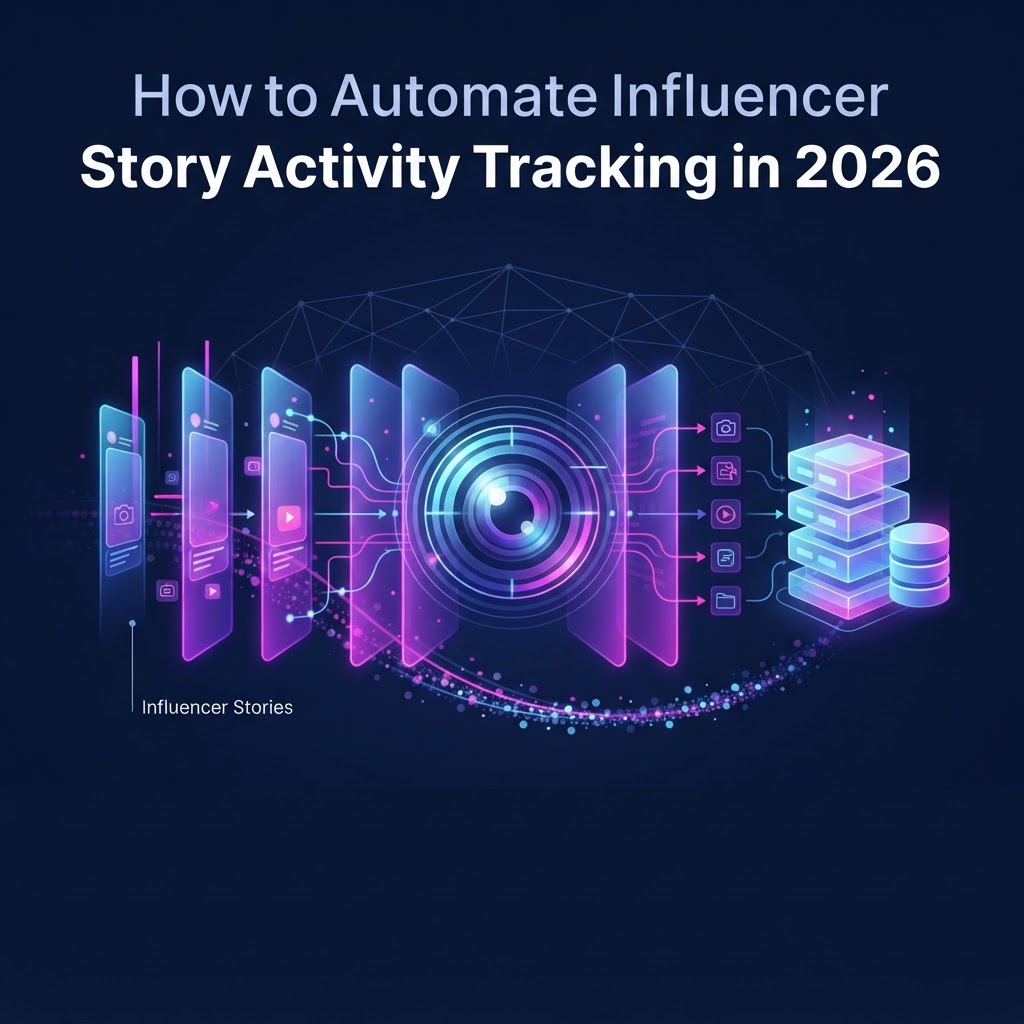
- Leverage Stories for Deeper Engagement. Stories are the engine of modern Instagram interaction. The interactive elements—polls, sliders, questions, and quizzes—are designed to generate immediate data on your audience’s preferences. By looking at the tap-forward and tap-back rates in your story insights, you can gauge exactly how engaging your narrative flow is. If users consistently tap forward, your story is likely too long or irrelevant. Use this data to tighten your storytelling and increase the time spent on your profile.
- Segment Your Content Based on Performance. Take your insights further by tagging your posts by type, such as educational, promotional, personal, or behind-the-scenes. Compare the interaction rate of these segments. You might discover that while educational content gets more saves, your promotional content actually drives higher profile visits. This dual-track strategy ensures that you are providing value while simultaneously pushing your business goals forward.
Try InstaSPY now
View your first Instagram profile anonymously for free
Enter a username to view available stories, highlights, reels, and posts without an Instagram login.
No Instagram password required